Housing costs in the United States continue to soar, as supply-chain snarls and rising mortgage rates hamper the real estate market. Older Americans, who face growing affordability challenges, may find limited options when looking for a home for their golden years.
Fortunately, AARP’s Public Policy Institute recently redesigned its Livability Index to make the search for a home a little easier to navigate.
The index was started in 2015 as a way to grade communities across the nation according to the services and amenities they provide. This year, AARP made the tool easier to use and expanded its data field, with researchers compiling and analyzing data from more than 50 sources, including the U.S. Census Bureau and the Centers for Disease Control and Prevention.
“You can find this information, but what we wanted to do make it available at one click,” said Rodney Harrell, the vice president of family, home and community at AARP.
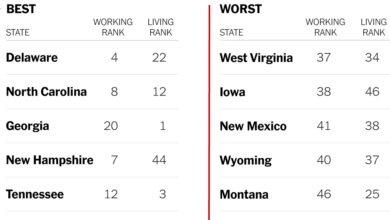
The tool uses 61 characteristics to evaluate locales across seven categories, including environment, housing and transportation. The site also ranks the top-scoring livable cities by population: large cities with more than 500,000 people, midsize cities (100,000 to 499,999), small cities (25,000 to 99,999) and small towns (5,000 to 24,999). Users can customize the results by choosing which categories are more important and prioritizing, for example, health care over job opportunities.
“There is no place that is ideal, but we want to lay out the facts to help people choose,” Mr. Harrell said.
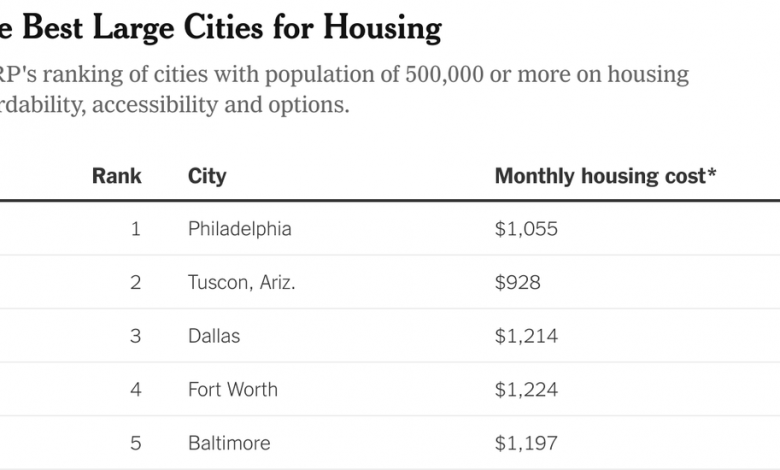
In the housing category, the index measures locations by three factors: affordability, which includes monthly costs and the availability of subsidized housing; accessibility, or the number of homes that can be entered without steps; and variety of housing options.
Among large cities, Philadelphia topped the housing category, according to data compiled for The New York Times by AARP. The city improved its availability of multifamily housing this year, to 91.1 percent from 90.6 percent in 2015 (the share of multifamily housing in the U.S. median neighborhood is a mere 18 percent). Housing costs grew in the same period, to $1,055 a month from $903, but the housing cost burden, or the portion of income spent on housing, fell to 13.1 percent from 13.5 percent.
Among midsize cities, Cincinnati was No. 1, followed by Pompano Beach, Fla., Syracuse, N.Y., Miami and Cleveland.
Source link