
Explore the nine sortable tables below to discover how the states and the District of Columbia compare with each other and with the nation on demographics, state residents’ highest level of education, faculty pay, college enrollment, diversity, graduation rates, tuition costs, state aid, and more.
About the data.
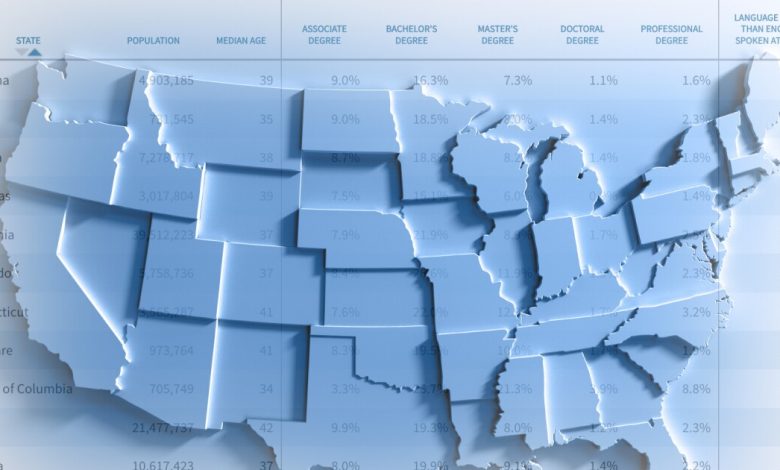
Data cover all degree-granting institutions in the United States that are eligible to receive Title IV federal financial aid, unless otherwise specified. Data on state population, age distribution, educational attainment, the proportion of state residents who speak a language other than English at home, per capita income, and the poverty rate are from the U.S. Census Bureau’s American Community Survey. Data for almanac year 2022 uses 2020 5-year estimates. All other years are based on the corresponding 1-year estimate (eg. 2019 data for 2021 almanac year). Racial categories include people of Hispanic origin, and the percentage of Hispanics is also given separately.
The projected change in new high-school graduates over the next decade is estimated for the period from 2021-22 to 2031-32 for almanac year 2022. Data are from the Western Interstate Commission for Higher Education.
Overall enrollment, enrollment by race and ethnicity, and the number of institutions in each sector are from the U.S. Department of Education for the fall of 2020 in almanac year 2022. Minority enrollment represents American Indian/Alaska Native, Asian, Black, Hispanic, and Native Hawaiian/Pacific Islander students, and students of two or more races. Racial categories for enrollment exclude people of Hispanic ethnicity, who are shown separately and may be of any race. “Nonresident aliens” are natives of foreign countries who are studying in the United States on a temporary basis. Percentages may not add to 100 because students whose race was unknown were excluded.
Average pay of full-time professors is from the 2020-21 academic year for almanac year 2022, as reported to the U.S. Department of Education, and is adjusted to a standard nine-month work year. Medical-school faculty members are excluded. The number of degrees awarded is based on U.S. Department of Education data collected for the 2019-20 academic year in almanac year 2022. Professional degrees like medical and law degrees are included in the number of doctorates. Average tuition and fees cover undergraduate charges for 2020-21 in almanac year 2022 and are weighted by full-time-equivalent undergraduate enrollment. Figures for public institutions represent charges to state residents. Six-year graduation rates are for first-time, full-time, degree-seeking students who entered degree-granting four-year institutions in the fall of 2014, for almanac year 2022, and graduated within six years. Those figures are also from the U.S. Department of Education.
SAT scores are for 2021 for almanac year 2022; figures are from the College Board. ACT scores are also for 2021 for almanac year 2022. One-year change in state funds for higher-education operating expenses reflect the difference between 2020-21 and 2021-22 for almanac year 2022; data are from the Center for the Study of Education Policy at Illinois State University and the State Higher Education Executive Officers. Total state spending on student aid is for 2019-20; data are from the National Association of State Student Grant and Aid Programs.
Earlier almanac years’ data is drawn from corresponding years of source data. For example, SAT scores for almanac year 2020 are from 2019.
Source link