
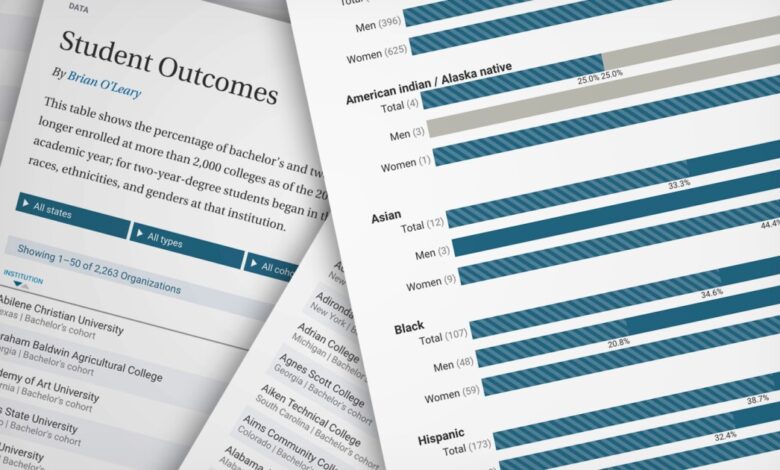
This table shows the percentage of bachelor’s and two-year-degree seeking students graduating, transferring, still enrolled or no longer enrolled at more than 2,000 colleges as of the 2018-19 academic year. Bachelor’s seeking students began in the 2012-13 academic year; for two-year-degree students began in the 2015-16 academic year. Click the institutions’ names to see outcomes for all races, ethnicities, and genders at that institution.
|
: Students
- Graduated in 100% time
- Graduated in 150% time
- Transferred Out
- Still enrolled
- No longer enrolled
Note that students that graduated with other degrees, usually of shorter duration, are not included in any of these groups.
About the data
The figures are from the Education Department’s Integrated Postsecondary Education Data System. They include associate- and bachelor’s degree granting institutions in the 50 states and Washington, D.C. Special-focus colleges are omitted from the list, as are those with degree-seeking cohorts of fewer than 100 students of all races/ethnicities. Colleges with cohorts seeking four-year degrees categorized as not equivalent to bachelor’s degrees have been omitted. Where both associate-seeking and bachelor’s seeking students were enrolled, we included only the largest cohort.
Students completing in 100-percent time (four years for bachelor’s degrees, two years for two-year degrees) are also included in the 150-percent category (six years for bachelor’s, three years for two-year degrees). Some students in a cohort might graduate with a degree other than that which they set out to earn (usually of a shorter duration); those students are not included in the completion percentages.
The full list of race/ethnicities is: American Indian or Alaska Native; Asian; Black or African-American; Hispanic or Latino; Native Hawaiian/Other Pacific Islander; two or more races; total minority; white; and race/ethnicity unknown. Those categories include U.S. citizens and permanent residents. “Nonresident alien” includes international students who could be of any race. A person can be counted in only one category; Hispanics can be of any race.
“Total minority” is the percentage of all students who are not categorized as white, race unknown, or nonresident alien. Some colleges reported a large number of students in the “race/ethnicity unknown” category. In those cases, all of the other figures should be interpreted with caution.
Source link