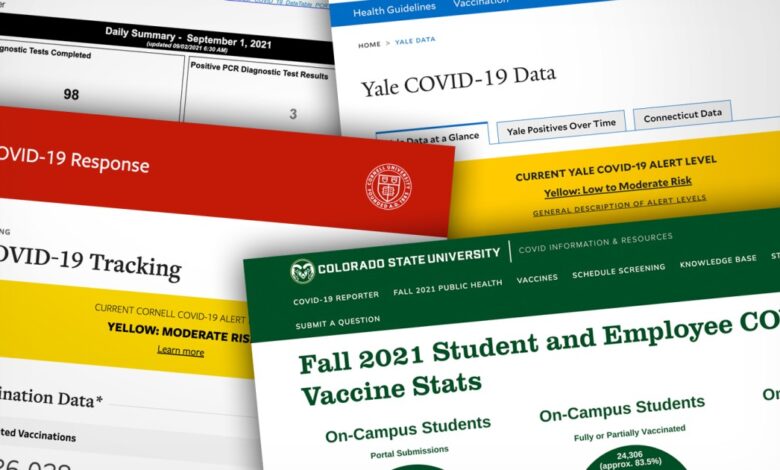
Imagine that you wanted to compare Covid-19-vaccination rates at Colorado’s two largest universities, which both require employees and students to get the shot.
If you visited Colorado State University’s vaccine dashboard, you’d see that approximately 83.5 percent of on-campus students, based on projected enrollment, and approximately 81 percent of employees had been fully or partially vaccinated as of September 1.
Hop on over to the University of Colorado at Boulder’s Covid-19 dashboard, and you’d also find vaccination rates for students and employees. Boulder’s numbers are significantly higher, with the vaccination rate at 96 percent for both students and employees as of September 2. But those rates don’t include everyone on campus — only those who have notified the university of their vaccination status are counted.
Some simple math reveals that the vaccination rates on the two campuses are more similar than they appear: 96 percent of students and 92 percent of employees who reported back to CSU have been fully or partially vaccinated. But few people consider these nuances. The statistics colleges publish on vaccine uptake are often what makes them look best, not what is most helpful to assess Covid risk on campus, experts say.
Some colleges make their vaccination dashboards easy to find; others bury them in more-comprehensive coronavirus dashboards. Some lump together vaccination rates for students, faculty, and staff; others separate them out. Some list only numbers, some list only percentages, and some list both. Some only provide statistics for residential students, while some give stats for all students.
This inconsistency makes it difficult to draw direct comparisons between institutions, mirroring troubles with coronavirus-case dashboards that emerged last fall. “There is no uniform standard for which statistics dashboards should include or how often to update them,” The Chronicle’s Michael Vasquez wrote in September 2020.
The same could be said for today’s vaccination dashboards.
Howard P. Forman, a professor of public health at Yale University, said he appreciated that his institution’s dashboard breaks down the vaccination rates by group: undergraduates, graduates, faculty, staff.
“One of our peer institutions has it bundled together, and other schools seemingly don’t talk about their vaccination rate or might talk about it in passing in an email, and weeks can go by before you get any type of update on that,” Forman said. “I think the vaccination rate is the one thing that we never had to deal with when we were doing this a year ago, and now it’s a big issue.”
Further adding to the confusion, Forman said, is that some colleges that require the vaccine do not have vaccination dashboards, and some that do not require it do.
When Dashboards Are Useful
Administrators must carefully consider the purpose of publishing vaccination data — and the effect it can have on the campus community, experts say.
The main purpose of these dashboards, said Chris Marsicano, the director of Davidson College’s College Crisis Initiative, is to offer campus community members a sense of “safety and security.” Although it may seem counterintuitive, at colleges where vaccination rates are very high, such as Davidson (Marsicano said the rate among students was at 98 percent), a dashboard may not be useful.
“Colleges are either going to require the vaccine or they’re not,” Marsicano said. “And if they’re requiring the vaccine, then you can be sure that 90-plus percent of the students are going to have vaccines, even if there are cases of exemptions. Campuses where that is not the case, it may be more useful.”
At the same time, at a college with a very low vaccination rate, an administration may not want to publish their numbers to avoid causing panic among students. But it’s critical that they at least know the data.
“There’s no one-size-fits-all approach here,” he said.
In addition to providing a metric of campus safety, Marsicano said, vaccine dashboards also disrupt the narrative of “irresponsible students not being vaccinated.” At many campuses, he said, vaccination rates are higher among students than employees.
“The only way to know that story is because of these dashboards,” Marsicano said.
The reality of a perfect return to campus was always a pipe dream, but scapegoating threatens the delicate relationships between students, faculty, and administrators as they set norms for the year.
“There’s often an assumption that students are causing trouble, when in reality students want nothing more than to get out of their parents’ basement and into the classroom and resume a college experience that they were promised in TV and in the movies,” Marsicano said. “And so, it is one of those situations where the quicker faculty and staff can get vaccinated, and the quicker that faculty and staff can show their students, ‘Look, we’re in this with you,’ the quicker we can get to normal resumption of that college life that students want.”
What Makes a Good Dashboard
Frank LoMonte, the director of the University of Florida’s Brechner Center for Freedom of Information, said that when it comes to vaccination data, the more granular, the better.
“If you are aggregating the data, then you can’t tell whether you need to do more catch-up work in educating the students or the faculty or the staff, and one data set could be throwing off the percentage of the other data set,” LoMonte said.
And even if the sample size is small, LoMonte said, it is almost always best to push out all the data at a college’s disposal.
“My No. 1 advice to agencies is always, if you are being asked for a piece of data over and over again, you should publish that piece of data, because people keep asking for it,” LoMonte said. “That is proof positive that that is a data point that is a matter of public interest, and so why not publish it, even if you have to publish it with a whole bunch of explanations and caveats attached?”
Source link