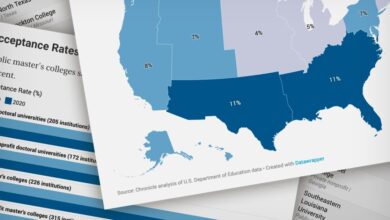
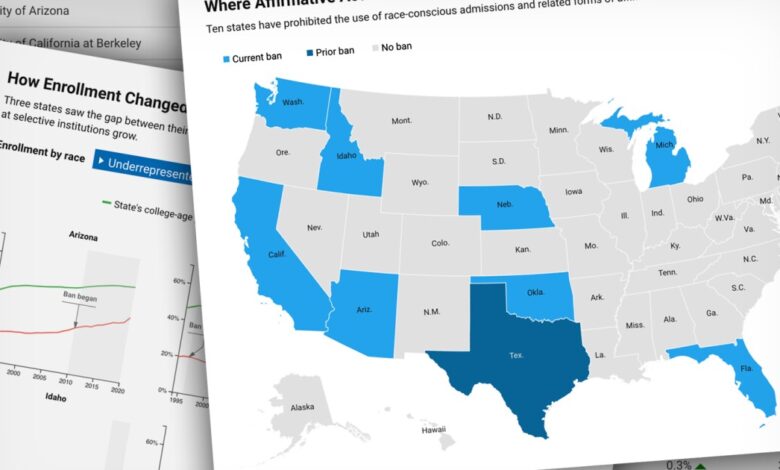
Ten states have prohibited the use of race-conscious admissions and related forms of affirmative action since the 1990s. Hover your cursor over each of those states for key population and enrollment statistics.
This fall the Supreme Court is set to hear arguments in two cases that challenge race-conscious admissions. The court’s decision, which isn’t expected until 2023, could result in a national ban of the practice.
To glimpse the potential impact of such a ruling, The Chronicle looked at how underrepresented-minority enrollment has shifted in the 10 states that have outlawed affirmative action. The Chronicle’s analysis considers enrollment at 30 selective public institutions in states with bans on race-conscious admissions.
Those bans apply only to public institutions. The two cases before the court this fall could result in bans at private colleges as well.
Three states saw the gap between their underrepresented-minority population and their in-state underrepresented-minority enrollment at selective institutions grow.
Enrollment by student type
State’s college-age population
Enrollment at selective, four-year institutions in each state
See all
Note: The “Ban began” labels indicate the years that the policies were put in place, but they may not have affected the admissions cycle of that year.
The vast majority of flagship campuses with state bans on race-conscious admissions did not see their underrepresented-minority enrollment increase at the same rate as their state’s underrepresented-minority population of college age.
| Flagship university | Year of state’s ban | Underrepresented-minority enrollment change from ban to 2020 | Underrepresented-minority population change from ban to 2020 |
|---|---|---|---|
|
University of Arizona |
2010 |
4.1% |
5.0% |
|
University of California at Berkeley |
1996 |
6.2% |
7.9% |
|
University of Florida |
1999 |
7.2% |
9.6% |
|
University of Idaho |
2020 |
N/A |
N/A |
|
University of Michigan at Ann Arbor |
2006 |
-2.2% |
3.1% |
|
University of Nebraska at Lincoln |
2008 |
6.3% |
5.6% |
|
University of New Hampshire |
2012 |
0.1% |
1.7% |
|
University of Oklahoma at Norman |
2012 |
0.3% |
3.9% |
|
University of Texas at Austin |
1996 – 2003 |
1.7% |
2.8% |
|
University of Washington |
1998 |
6.3% |
10.3% |
Note: Enrollment represents first-year, first-time degree-seeking undergraduates. Idaho data are omitted because the ban was instituted too recently for statistical change to be recorded.
Methodology
The state population estimates of 18-to-24-year-olds by race are from the Centers for Disease Control and Prevention’s Bridged-Race Population Estimates.

The enrollment figures are from the U.S. Education Department’s Integrated Postsecondary Education Data System. They represent fall-enrollment counts. From 1994 to 2007 the enrollment figures for “Asian or Pacific Islander” do not include Hawaiian Natives. After 2007 that group is represented in this category. “Underrepresented minorities” are defined as American Indian and Alaska Native, Black, and Hispanic students.
The percentage of underrepresented minorities in each year was calculated by dividing the total number of students in those three groups into the total number of students, minus those whose race or ethnicity was unknown, who were nonresident aliens, or who were of two or more races.
Institutions were defined as selective based on the 2018 Carnegie Undergraduate Profile classifications. Institutions that were classified as “more selective” as well as each state’s flagship institution were included in this analysis.
Source link