New USDA Plant Hardiness Zone Map 2023: What Changed & Why?

[ad_1]
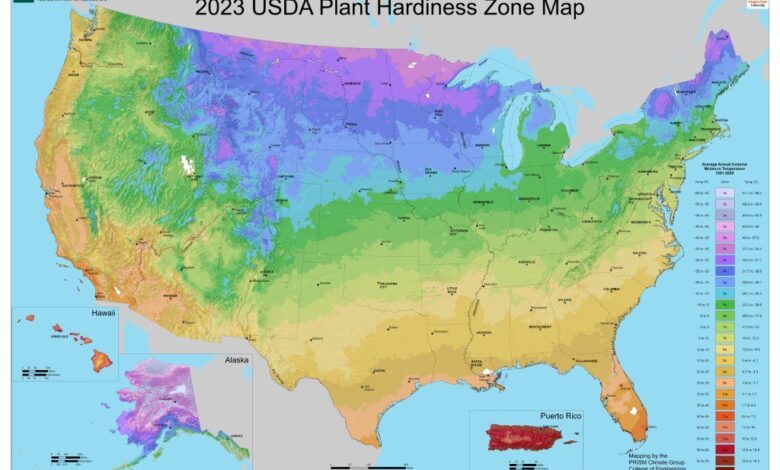
Climate and temperature averages change, so the USDA periodically updates its zones. The New USDA hardiness zone map was released at the end of 2023. It replaces the old hardiness zone map and includes updated climate data from 1991 to 2020.
The U.S. Department of Agriculture (USDA) plant hardiness map is a crucial tool for plant selection. Each zone on the map is defined by average annual minimum temperatures. A zone represents 10 degrees and is further subdivided by five-degree subzones. If a plant is hardy in a zone, it is likely to survive the winter and grow as an annual there.
Why Did the USDA Hardiness Zone Map Change?
According to the USDA, the new hardiness zone map is the most accurate and detailed map it has produced. The USDA developed it with the PRISM Climate Group at Oregon State University. The current map includes temperature data from over 13,000 weather stations. This is compared to just under 8,000 weather stations used to create the last map, released in 2012.
What’s New in the USDA Hardiness Zone Map?
The new USDA plant hardiness zone map is characterized by shifts to warmer zones in many areas of the map. It shows an overall increase in average temperatures of 2.5 degrees. Approximately half of the country has shifted to a warmer subzone while other regions remained in the same zone and subzone. Here are some additional highlights from the new map:
- Zones 12 and 13 – The USDA added zones 12 and 13 to the previous 1 through 11. These are for regions with annual average minimum temperatures higher than 50 and 60 degrees Fahrenheit. These new zones are only applicable to Puerto Rico and Hawaii.
- Biggest Shifts – While half the country has seen a shift to warmer temperatures, a few areas have the biggest changes. These include areas of Arkansas, Kentucky, Missouri, and Tennessee.
- Finer Details – Another new aspect of the map is that it has finer detail. Use the online map to zoom in on your region and see more detailed zone and subzone boundaries.
- Warmer Cities – Thanks to the finer detail used to create the new map, you will see higher average minimums in urban areas. Cities hold more heat in materials like concrete and asphalt.
- Milder Lakeside Gardens – The new map also allows you to see that you might be in a warmer subzone than the rest of your region if next to a lake or other body of water. Especially if you are downwind from the body of water, you may be in a slightly warmer zone than previously.
How the New Zone Map May Affect Gardeners
The new planting zone map may or may not affect your garden, depending on whether you shifted to a new zone or subzone. One shift in subzone is not a major change for gardeners, but it might allow you to choose some new plants that were previously just out of reach due to your zone.
The shifts also work the other way. A plant you grow that prefers colder temperatures might struggle more to survive a warmer summer in your zone.
The changes in temperature affect more than the plants that can grow in a zone. A warmer climate means new pests and diseases. Gardeners must be aware of which pathogens or insects might be moving into their area as the climate warms. These changes might require new preventative measures, such as choosing different plant varieties.
While climate change has become a political issue, the shifts in the USDA zone map come as no surprise to most longtime gardeners. If you spend a lot of time outdoors in your garden, you have likely noticed the changes and how they affect plants and wildlife. The new map corroborates what gardeners already knew.
[ad_2]
Source link


